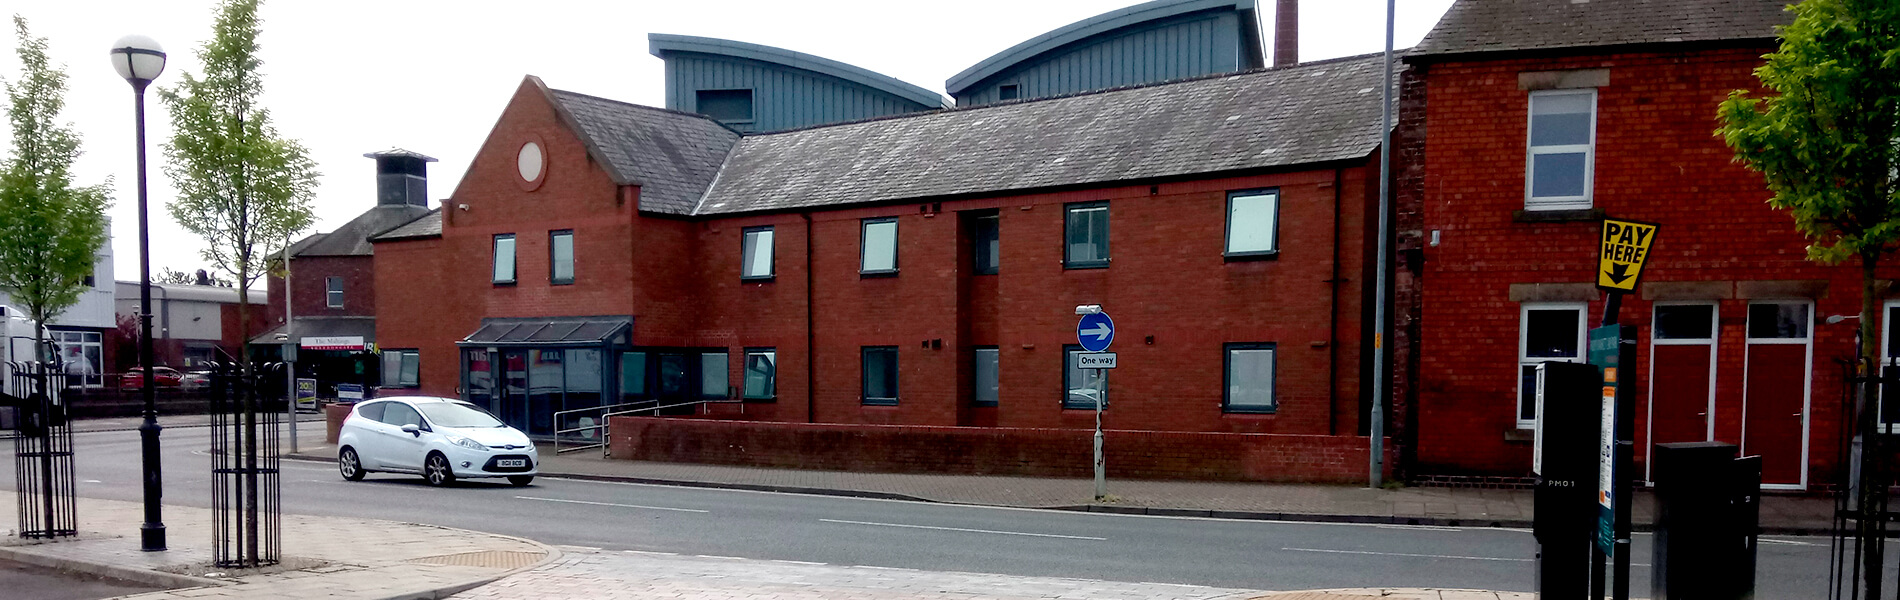
John Street Hostel is run by Carlisle City Council and provides emergency accommodation for up to 20 homeless men in individual bedrooms. In 2015, the hostel was severely flood-damaged by Storm Desmond, requiring the complete renovation of the ground floor, and the hostel finally re-opened in the spring of 2018.
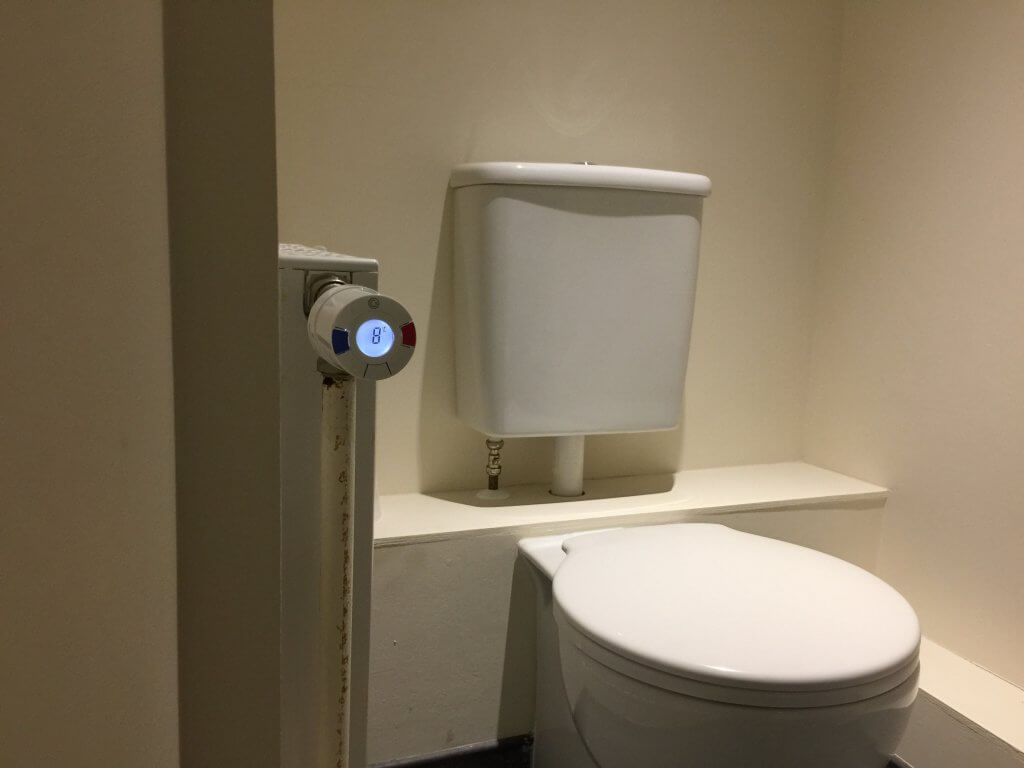
The Manager, Peter Rhodes, explained that prior to the renovation the hostel did have a Building Energy Management System (BEMS) but this didn’t provide room-by-room control of the heating. As a result, especially in the colder months, some rooms would be overheated whilst others were left too cold. The necessary refurbishment following the storm provided an opportunity to install a completely new system that would offer much better control – and the Genius Hub was chosen.
What were your first impressions of the Genius Hub?
Peter Rhodes: “The user-interface seemed quite daunting at first, just because of the level of control we now had. Before we only had a time clock for the boiler and now we had one for every room, and I felt quite apprehensive about this, but as I got used to it I realised that, once set, we could just leave it alone to look after itself. This was excellent, as we didn’t want a system that we had to keep adjusting all the time,”
How was the installation?
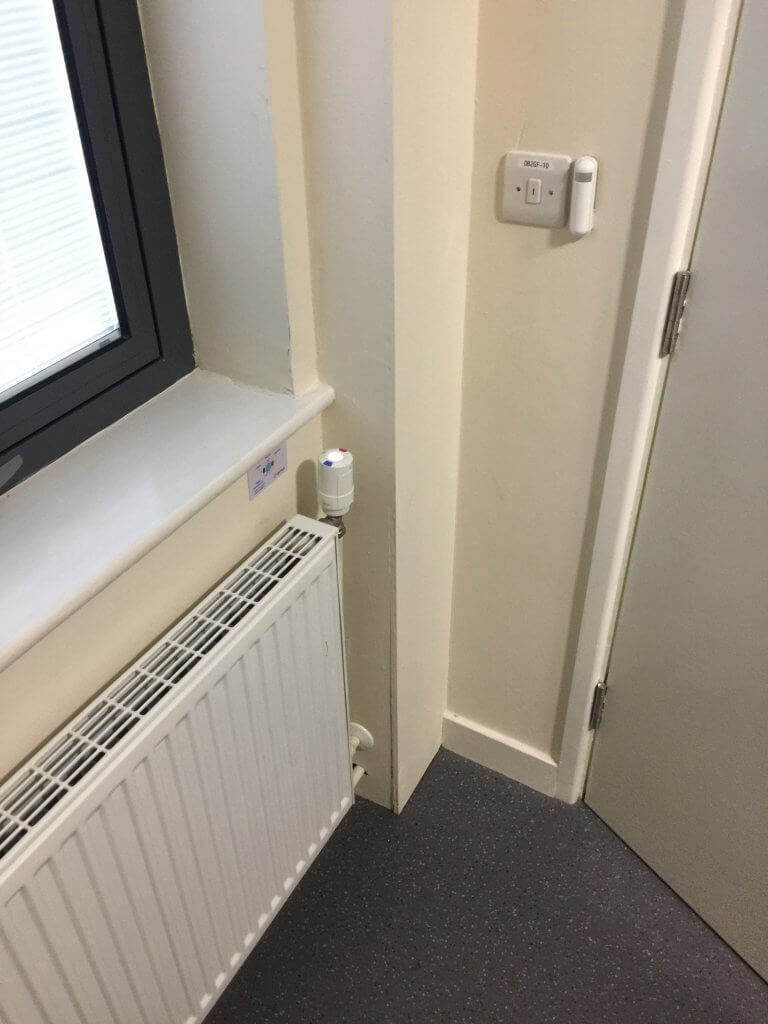
Peter Rhodes: “The installation was completely non-intrusive and caused no disruption at all. Much of the equipment was installed in the loft space so there was little reason to go into any of the guest’s rooms.”
What have you liked about the Genius Hub system?
Peter Rhodes: “The flexibility and ease of use of the system is important, but a major plus has got to be the cost savings as it all comes out of our budget to run the hostel.”
Have you benefited in any other way?
Peter Rhodes: “Having each of the rooms individually controllable has been very much appreciated by our residents. We can check on the temperatures in the individual rooms and it is excellent that the system manages itself and we only need to tweak it from time to time.”
ABSTRACT:
The purpose of this report is to analyse the gas data provided by the Carlisle City Council for before and after the installation of the Genius Hub system to determine the energy saved as a result (to within the greatest degree of accuracy as possible). This report found an average saving of 50% since the installation of the Genius Hub system in October 2018, at the time of writing. Note that the predicted energy savings on this site given the level of existing control (BEMS & modern TRVs on all radiators) was 25%. The 50% saving on the energy bills achieved has given the whole project a 2.1 year payback.
PROJECT INCENTIVES:
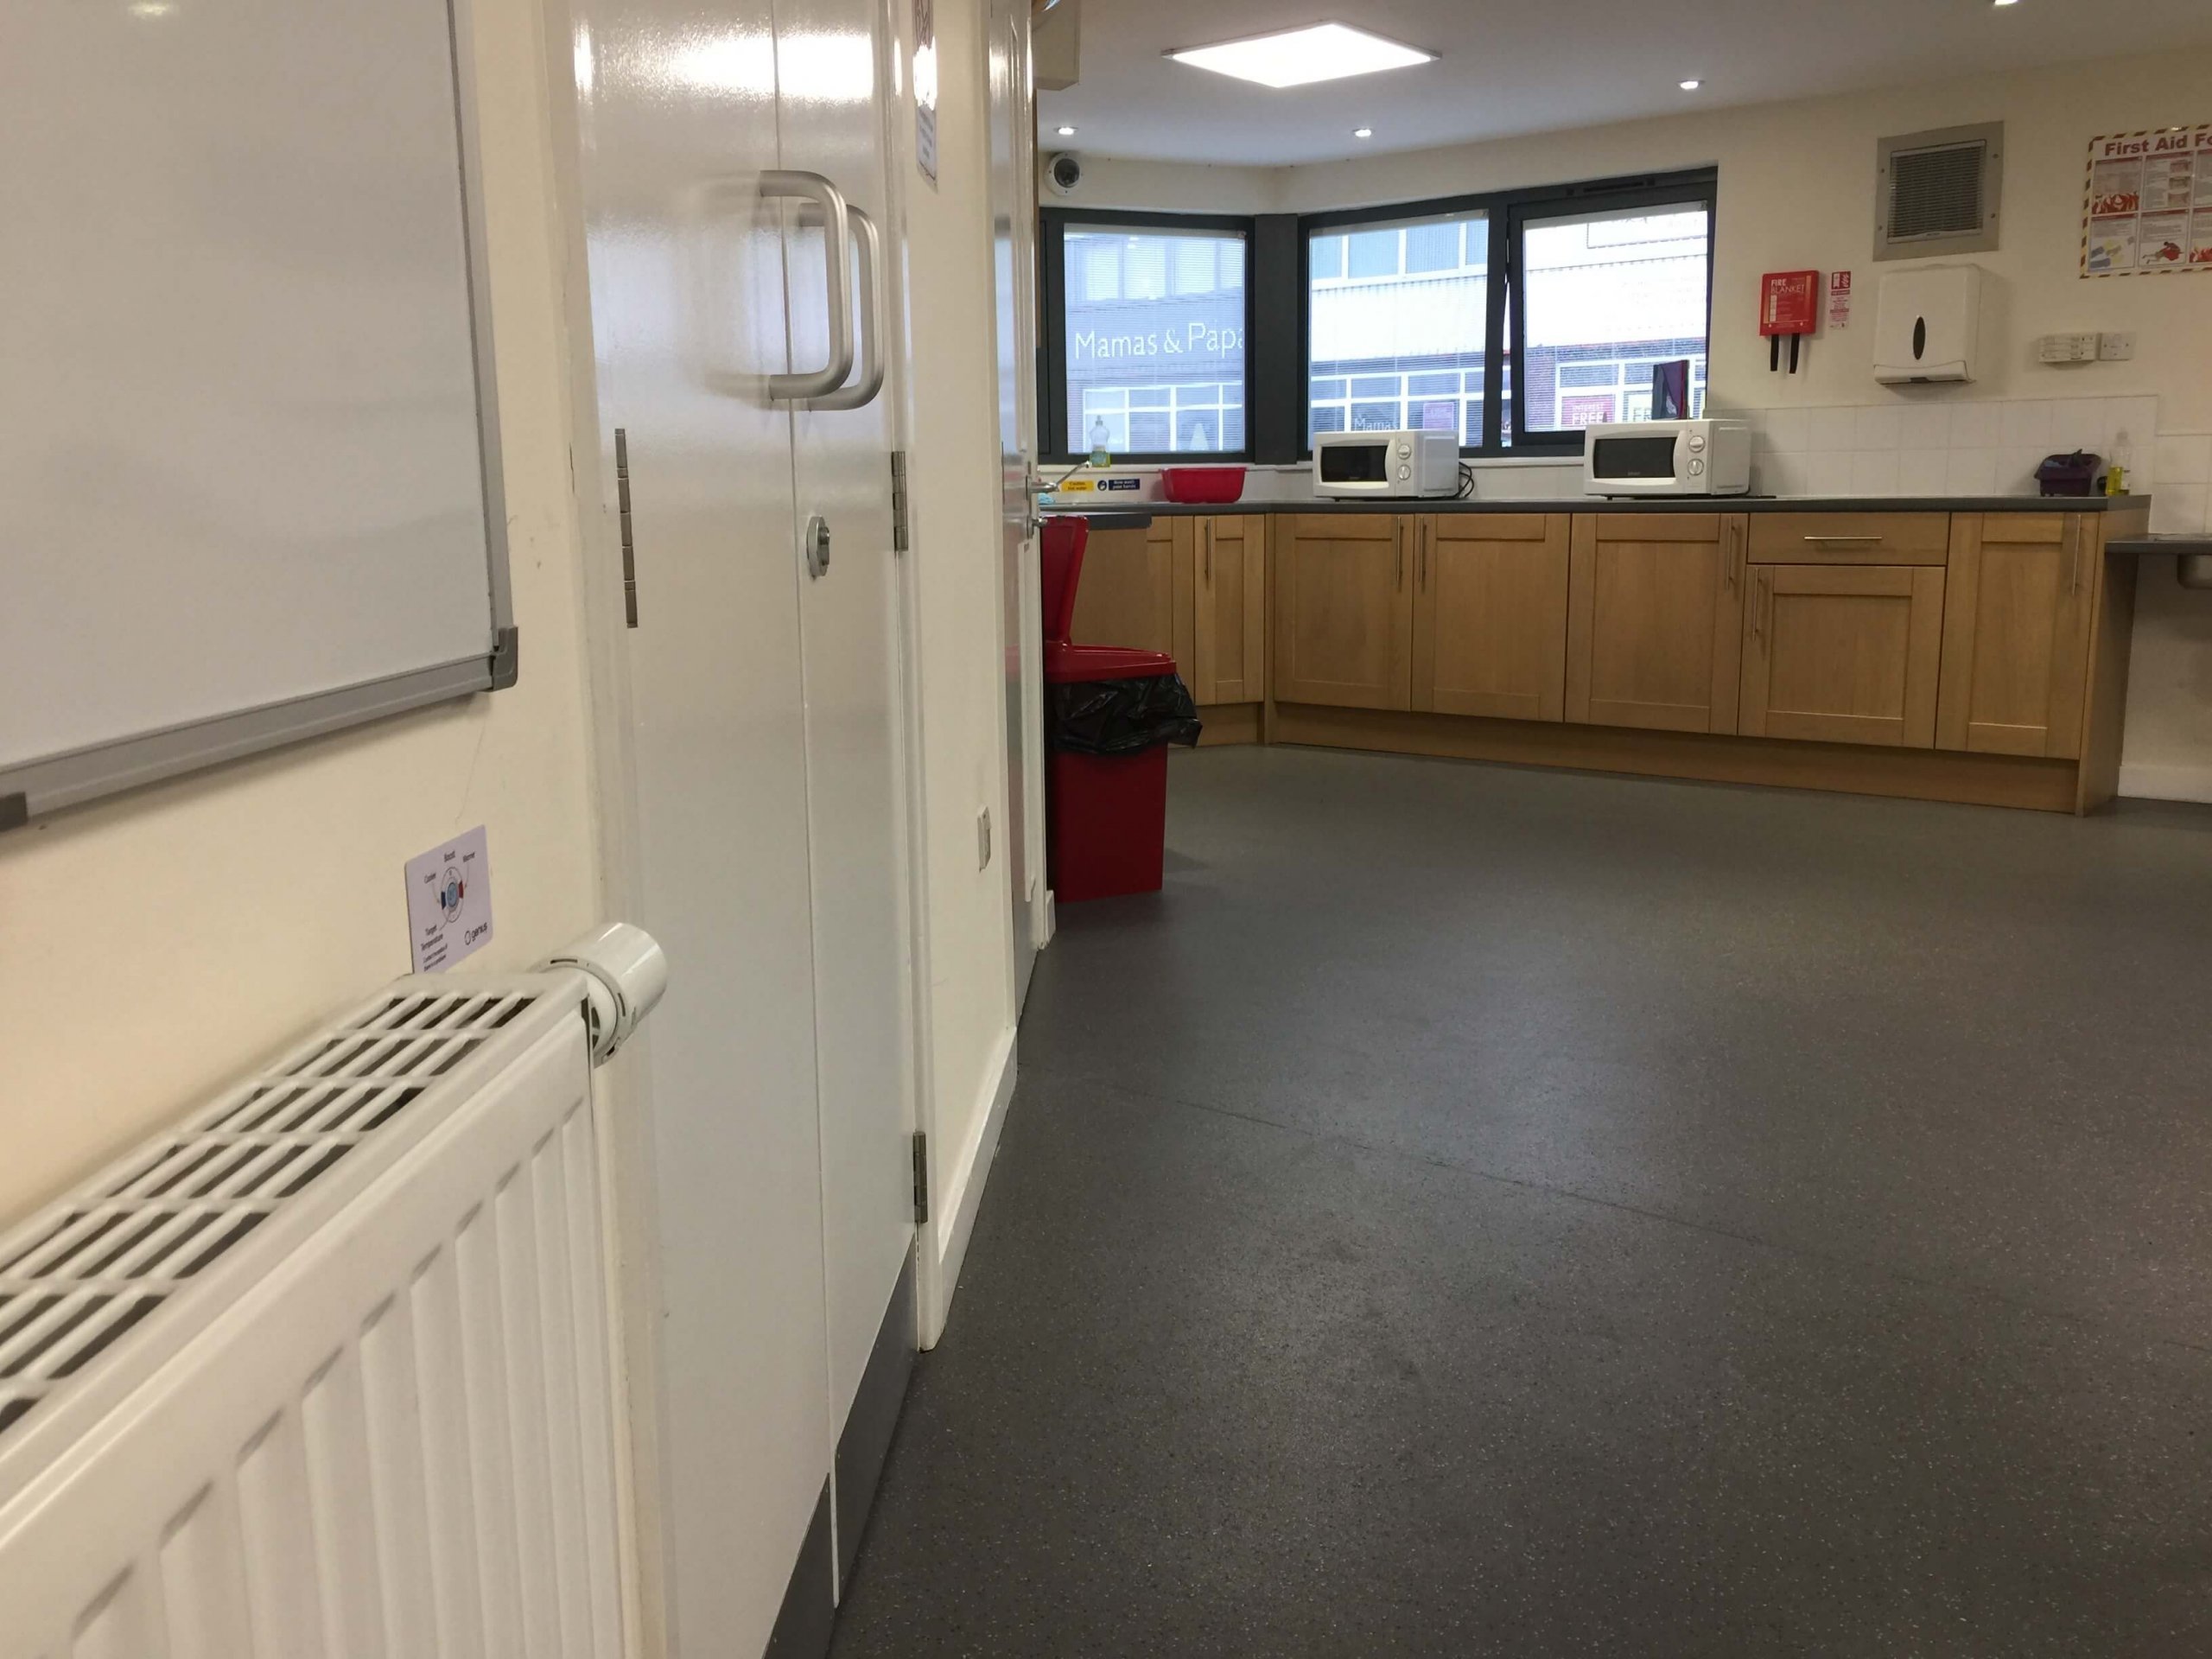
John St. Homeless Hostel is frequently in high demand and has a high turnover of residents. The building has 20 ensuite bedrooms, as well as a dining hall, communal area and staff offices. Carlisle City Council (CCC) recognised the Genius Hub system as a low cost & effective energy saving measure that could be easily retrofitted with little or no disruption to the occupants of the building. The aim of this pilot project was to help the council cut energy costs while maintaining comfort levels.
PERIOD OF DATA:
The relevant dates for this installation are:
Gas data for Oct 2017 – Aug 2018 has been compared with the data for Sept 2018 – March 2018. The kWh/Degree Day ºC has been used as a way of comparing concurrent weeks in a calendar year while taking into account fluctuations in external temperature. Like ‘miles per gallon’, but where the type of road and driving conditions have been standardised.
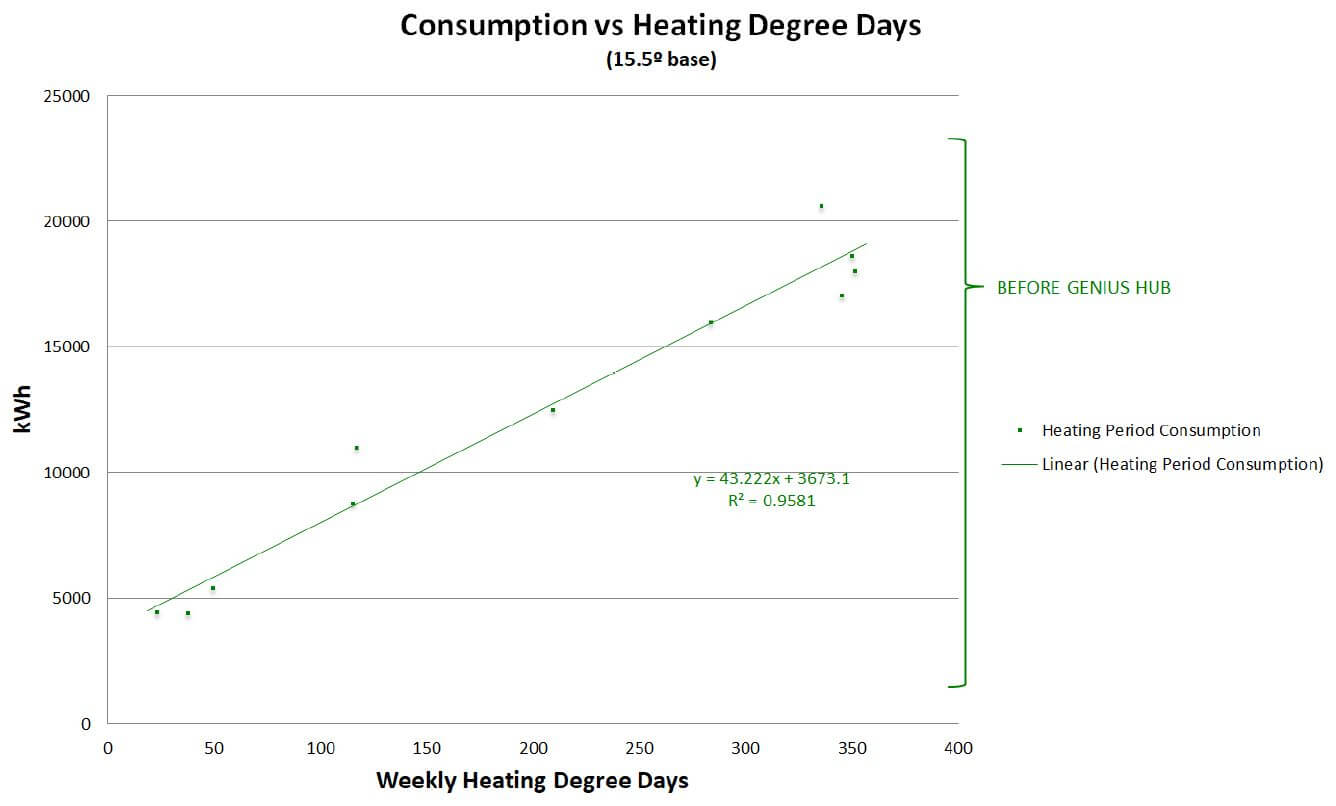
BEFORE INSTALLATION:
When the external temperature drops the building is under heated and when it is warmer
outside the building overheats.
The R2 value is a measure of how tightly the data points fit the trendline. This can also be thought of as a measure of the proportionality between two variables. An R2 value of >0.95 is deemed an exceptionally accurate data set. Graph showing the energy consumption prior to installation of the Genius Hub system; 01/10/2017 – 12/09/17.
AFTER INSTALLATION:
From the data provided, this report finds an average saving of 50% for the time period being monitored. It is likely that this figure will not be entirely accurate as the data provided is not of especially high resolution – however lengths have been taken in the calculations above to mitigate any discrepancies and take a worst case approach.
This report was put together by an industry specialist, using the widely accepted monitoring and verification processes and the guidelines set out by the International Performance Measurement and Verification Protocol (IPMVP). It was then independently verified by a 3rd party to confirm it’s accuracy and impartiality.